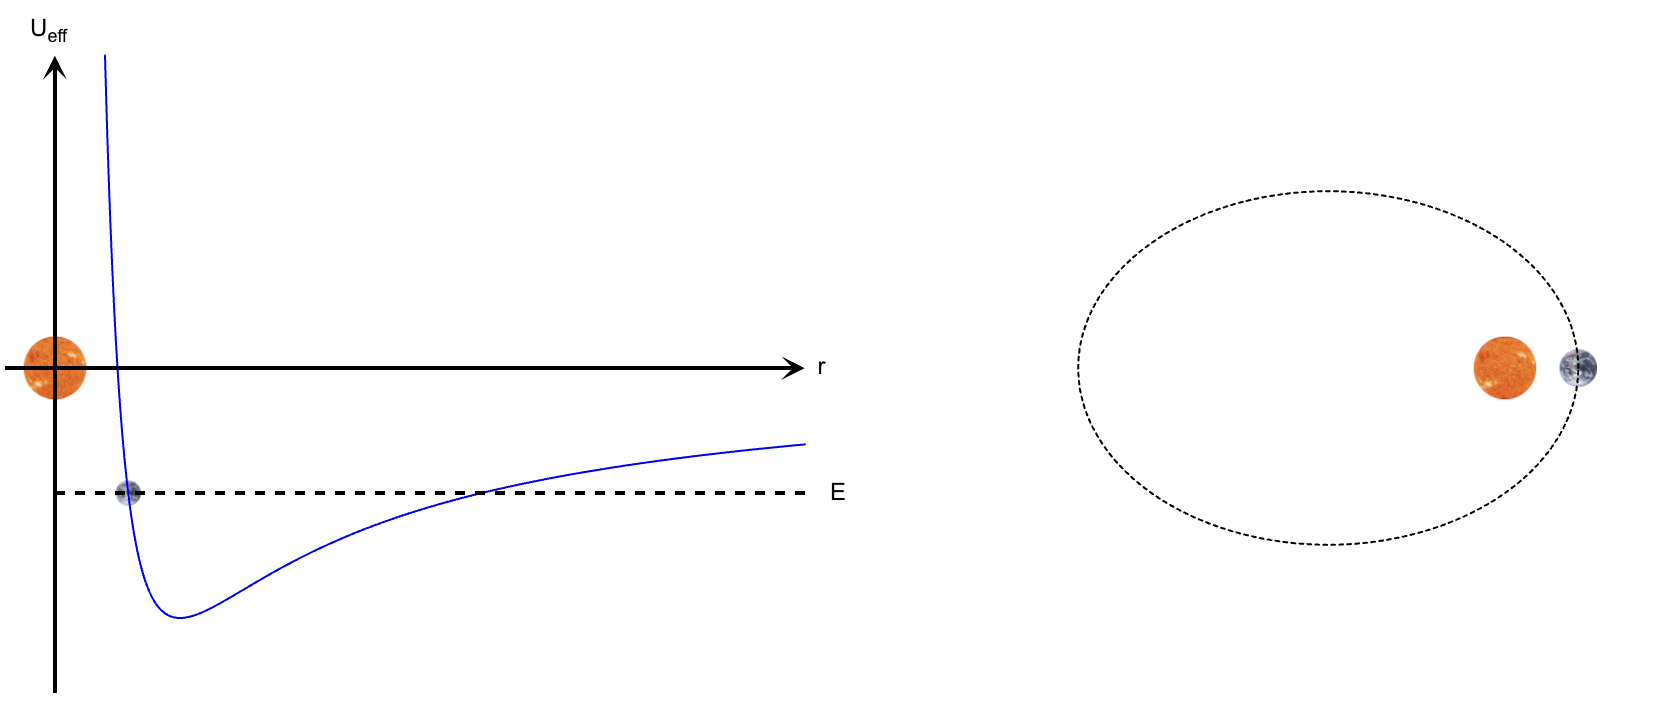
On the left is the graph
geogeboard 发布于 阅读:775 中文站
On the left is the graph of Ueff(r) for some non-zero value of L. This picture is incredibly useful, because you can understand what's going to happen to a mass that's moving in this potential just imagining that it's a hill that the particle is sliding along.
The shape of the orbit will depend on the energy, represented by the horizontal dashed line. When the energy is at the minimum of the effective potential, the particle will just sit there at the bottom of the hill! That means that r is constant. The planet isn't sitting still—remember that it has angular momentum L=mr2θ˙, and so the angular coordinate is changing. So when the energy is at the minimum of the effective potential, the planet will orbit the star in a circle!